The Material consumption chart is used to see the total consumption of a component for a resource(s) over a defined period of time. One of its applications is for determining if the consumption of SKUs across several packaging lines meets or exceeds the output rate for upstream resources.
This feature gives the planner the ability to predict any overflow or spillage of material from the upstream resource(s) based on the current plan.
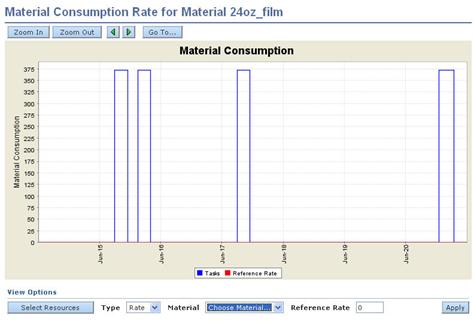
From the Planning Board, choose Analysis > Material Consumption or select View Item’s Material Consumption using the right-click menu. An example is shown below:
Table 62: Material Consumption Chart
|
Field |
Description |
|
Zoom In/Zoom Out |
Click Zoom in to get a closer view of the chart; Click Zoom Out to show more days on the chart. |
|
Roll Forward/Backward |
Click the forward arrow to view the following period’s material consumption; click the backward arrow to view the previous period’s material consumption. |
|
Go To… |
Roll the chart forward or backward by choosing a date from the calendar. |
|
Select Resources |
The chart defaults to the Resource for the current schedule on the Planning Board. Click Select Resources to view material consumption for another resource. |
|
Type |
The default for Type is Rate, which shows consumption of the materials in UOM per hour. Change to Level to show total consumption in the UOM of the material. |
|
Material |
If a task was selected in the Planning Board view, the material defaults to a material in the Task’s Item BOM, if there is one. If no task was selected on the Planning Board, the graph contains the previously shown material. |
|
Reference Rate |
Enter a Reference Rate to compare this rate to the consumption of the material across several lines The Reference Rate only applies to Rate charts. |
|
Apply |
Apply the changes to the chart. |